Jabil is a provider of manufacturing services and solutions. Co.'s manufacturing and supply chain management services and solutions include design, planning, fabrication and assembly, delivery and managing the flow of resources and products. Co.'s segments are: Electronics Manufacturing Services, which is focused around utilizing IT, supply chain design and engineering, technologies centered on main electronics, utilizing its manufacturing infrastructure and its ability to serve a range of end markets; and Diversified Manufacturing Services, which is focused on providing engineering solutions, with an emphasis on material sciences, machining, tooling, and molding of plastic and metal parts.
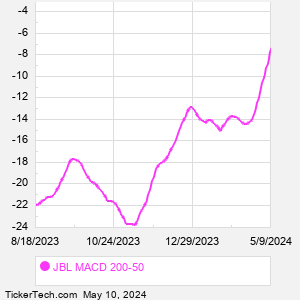
When researching a stock like Jabil, many investors are the most familiar with Fundamental Analysis — looking at a company's balance sheet, earnings, revenues, and what's happening in that company's underlying business. Investors who use Fundamental Analysis to identify good stocks to buy or sell can also benefit from JBL Technical Analysis to help find a good entry or exit point. Technical Analysis is blind to the fundamentals and looks only at the trading data for JBL stock — the real life supply and demand for the stock over time — and examines that data in different ways. One of those ways is to calculate a Simpe Moving Average ("SMA") by looking back a certain number of days. One of the most popular "longer look-backs" is the JBL 200 day moving average ("JBL 200 DMA"), while one of the most popular "shorter look-backs" is the JBL 50 day moving average ("JBL 50 DMA"). A chart showing both of these popular moving averages is shown on this page for Jabil. Comparing two moving averages against each other can be a useful visualization tool: by calculating the difference between the JBL 200 DMA and the JBL 50 DMA, we get a moving average convergence divergence indicator ("JBL MACD"). The JBL MACD chart, in conjunction with the chart of the moving averages, basically helps in visualizing how the moving averages are showing convergence (moving closer together), or divergence (moving farther apart). |