W.W. Grainger is a business-to-business distributor of maintenance, repair and operating (MRO) products and services with operations primarily in North America, Japan and the U.K. Co.'s product offering is grouped under several categories, including safety and security, material handling and storage, pumps and plumbing equipment, cleaning and maintenance, metalworking and hand tools. Co.'s two reportable segments are High-Touch Solutions N.A. and Endless Assortment. Co.'s High-Touch Solutions N.A. segment provides MRO solutions. Co.'s Endless Assortment segment provides an online platform with one-stop shopping for various products.
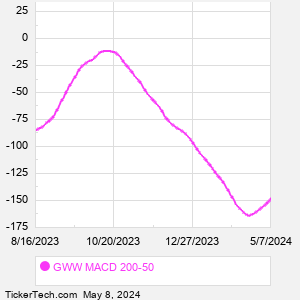
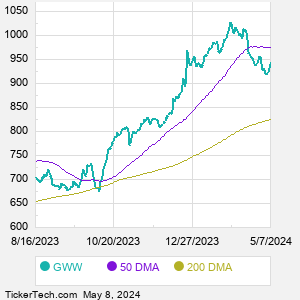
When researching a stock like W.W. Grainger, many investors are the most familiar with Fundamental Analysis — looking at a company's balance sheet, earnings, revenues, and what's happening in that company's underlying business. Investors who use Fundamental Analysis to identify good stocks to buy or sell can also benefit from GWW Technical Analysis to help find a good entry or exit point. Technical Analysis is blind to the fundamentals and looks only at the trading data for GWW stock — the real life supply and demand for the stock over time — and examines that data in different ways. One of those ways is to calculate a Simpe Moving Average ("SMA") by looking back a certain number of days. One of the most popular "longer look-backs" is the GWW 200 day moving average ("GWW 200 DMA"), while one of the most popular "shorter look-backs" is the GWW 50 day moving average ("GWW 50 DMA"). A chart showing both of these popular moving averages is shown on this page for W.W. Grainger. Comparing two moving averages against each other can be a useful visualization tool: by calculating the difference between the GWW 200 DMA and the GWW 50 DMA, we get a moving average convergence divergence indicator ("GWW MACD"). The GWW MACD chart, in conjunction with the chart of the moving averages, basically helps in visualizing how the moving averages are showing convergence (moving closer together), or divergence (moving farther apart). |