Airbnb operates a global marketplace, where hosts offer guests stays and experiences on its platform. Co.'s marketplace model connects hosts and guests online or through mobile devices to book spaces and experiences. For hosts, Co. provides global demand, activation and merchandising, pricing recommendations, scheduling, integrated payments, community support, host protections, reviews and feedback, and a Superhost program. As of Sept 30 2020, its more than 4 million hosts had 7.4 million available listings, of which 5.6 million were active listings. Co.'s listings include private rooms, entire homes, luxury villas, treehouses, igloos, and experiences.
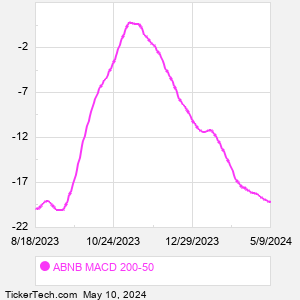
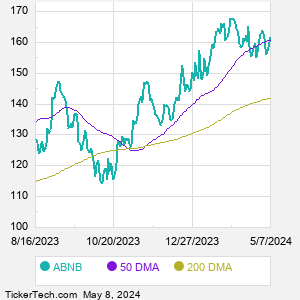
When researching a stock like Airbnb, many investors are the most familiar with Fundamental Analysis — looking at a company's balance sheet, earnings, revenues, and what's happening in that company's underlying business. Investors who use Fundamental Analysis to identify good stocks to buy or sell can also benefit from ABNB Technical Analysis to help find a good entry or exit point. Technical Analysis is blind to the fundamentals and looks only at the trading data for ABNB stock — the real life supply and demand for the stock over time — and examines that data in different ways. One of those ways is to calculate a Simpe Moving Average ("SMA") by looking back a certain number of days. One of the most popular "longer look-backs" is the ABNB 200 day moving average ("ABNB 200 DMA"), while one of the most popular "shorter look-backs" is the ABNB 50 day moving average ("ABNB 50 DMA"). A chart showing both of these popular moving averages is shown on this page for Airbnb. Comparing two moving averages against each other can be a useful visualization tool: by calculating the difference between the ABNB 200 DMA and the ABNB 50 DMA, we get a moving average convergence divergence indicator ("ABNB MACD"). The ABNB MACD chart, in conjunction with the chart of the moving averages, basically helps in visualizing how the moving averages are showing convergence (moving closer together), or divergence (moving farther apart). |