Ansys develops and markets engineering simulation software and services used by engineers, designers, researchers and students. Co. focuses on the development of solutions that enable users to analyze designs directly on the desktop, providing a common platform for product development, from design concept to final-stage testing and validation. Co.'s Discovery™ product family allows every engineer to benefit from the insight of simulation in their product design. Co. also provides Ansys Workbench™ connectivity, empowering analysts to do geometry preparation for simulation in Discovery, including materials selections and upfront simulation, with transfer to Ansys Mechanical and Ansys Fluent.
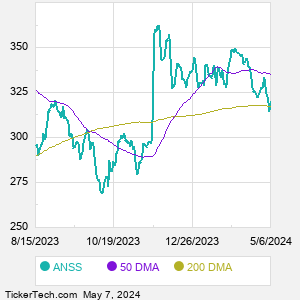
When researching a stock like Ansys, many investors are the most familiar with Fundamental Analysis — looking at a company's balance sheet, earnings, revenues, and what's happening in that company's underlying business. Investors who use Fundamental Analysis to identify good stocks to buy or sell can also benefit from ANSS Technical Analysis to help find a good entry or exit point. Technical Analysis is blind to the fundamentals and looks only at the trading data for ANSS stock — the real life supply and demand for the stock over time — and examines that data in different ways. One of those ways is to calculate a Simpe Moving Average ("SMA") by looking back a certain number of days. One of the most popular "longer look-backs" is the ANSS 200 day moving average ("ANSS 200 DMA"), while one of the most popular "shorter look-backs" is the ANSS 50 day moving average ("ANSS 50 DMA"). A chart showing both of these popular moving averages is shown on this page for Ansys. Comparing two moving averages against each other can be a useful visualization tool: by calculating the difference between the ANSS 200 DMA and the ANSS 50 DMA, we get a moving average convergence divergence indicator ("ANSS MACD"). The ANSS MACD chart, in conjunction with the chart of the moving averages, basically helps in visualizing how the moving averages are showing convergence (moving closer together), or divergence (moving farther apart). |