Akamai Technologies is engaged in the provision of cloud services for delivering, optimizing and securing content and business applications over the internet. Co.'s business is organized into two groups, both of which utilize the Akamai Intelligent Edge Platform and its global sales organization: the Security Technology Group and the Edge Technology Group. The Security Technology Group includes solutions that are designed to keep infrastructure, websites, applications and users safe, while the Edge Technology Group includes solutions that enable business online, including media delivery, web performance and edge computing solutions.
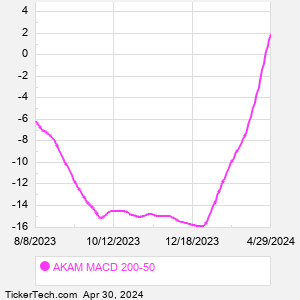
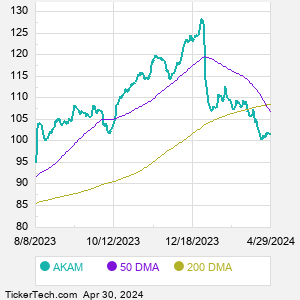
When researching a stock like Akamai Technologies, many investors are the most familiar with Fundamental Analysis — looking at a company's balance sheet, earnings, revenues, and what's happening in that company's underlying business. Investors who use Fundamental Analysis to identify good stocks to buy or sell can also benefit from AKAM Technical Analysis to help find a good entry or exit point. Technical Analysis is blind to the fundamentals and looks only at the trading data for AKAM stock — the real life supply and demand for the stock over time — and examines that data in different ways. One of those ways is to calculate a Simpe Moving Average ("SMA") by looking back a certain number of days. One of the most popular "longer look-backs" is the AKAM 200 day moving average ("AKAM 200 DMA"), while one of the most popular "shorter look-backs" is the AKAM 50 day moving average ("AKAM 50 DMA"). A chart showing both of these popular moving averages is shown on this page for Akamai Technologies. Comparing two moving averages against each other can be a useful visualization tool: by calculating the difference between the AKAM 200 DMA and the AKAM 50 DMA, we get a moving average convergence divergence indicator ("AKAM MACD"). The AKAM MACD chart, in conjunction with the chart of the moving averages, basically helps in visualizing how the moving averages are showing convergence (moving closer together), or divergence (moving farther apart). |