Deckers Outdoor is engaged in designing, marketing, and distributing footwear, apparel, and accessories. Co. markets its products primarily under the following proprietary brands: UGG, HOKA, Teva, Sanuk, and Koolaburra. Co. sells its products through domestic and international retailers, international distributors, and directly to its global consumers through its Direct-to-Consumer business, which is comprised of its e-commerce websites and retail stores. Co. operates its e-commerce business through Co.-owned websites and mobile platforms in different countries, and has various global retail stores, which includes concept stores and outlet stores.
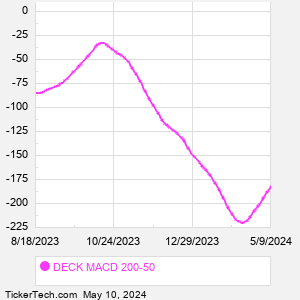
When researching a stock like Deckers Outdoor, many investors are the most familiar with Fundamental Analysis — looking at a company's balance sheet, earnings, revenues, and what's happening in that company's underlying business. Investors who use Fundamental Analysis to identify good stocks to buy or sell can also benefit from DECK Technical Analysis to help find a good entry or exit point. Technical Analysis is blind to the fundamentals and looks only at the trading data for DECK stock — the real life supply and demand for the stock over time — and examines that data in different ways. One of those ways is to calculate a Simpe Moving Average ("SMA") by looking back a certain number of days. One of the most popular "longer look-backs" is the DECK 200 day moving average ("DECK 200 DMA"), while one of the most popular "shorter look-backs" is the DECK 50 day moving average ("DECK 50 DMA"). A chart showing both of these popular moving averages is shown on this page for Deckers Outdoor. Comparing two moving averages against each other can be a useful visualization tool: by calculating the difference between the DECK 200 DMA and the DECK 50 DMA, we get a moving average convergence divergence indicator ("DECK MACD"). The DECK MACD chart, in conjunction with the chart of the moving averages, basically helps in visualizing how the moving averages are showing convergence (moving closer together), or divergence (moving farther apart). |