Moody's is a global integrated risk assessment firm that helps organizations and investors to make decisions. Co. reports in two segments: Moody's Investors Service (MIS) and Moody's Analytics (MA). The MIS segment publishes credit ratings and provides assessment services on a range of debt obligations, programs and facilities, and the entities that issue such obligations in markets worldwide, including various corporate, financial institution and governmental obligations, and structured finance securities. The MA segment is a global provider of data and information; research and insights; and decision solutions, which help companies make decisions.
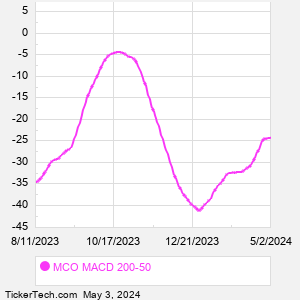
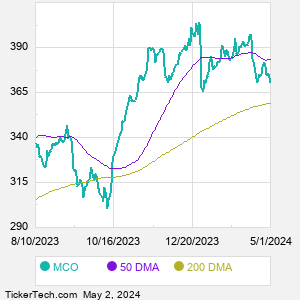
When researching a stock like Moodys, many investors are the most familiar with Fundamental Analysis — looking at a company's balance sheet, earnings, revenues, and what's happening in that company's underlying business. Investors who use Fundamental Analysis to identify good stocks to buy or sell can also benefit from MCO Technical Analysis to help find a good entry or exit point. Technical Analysis is blind to the fundamentals and looks only at the trading data for MCO stock — the real life supply and demand for the stock over time — and examines that data in different ways. One of those ways is to calculate a Simpe Moving Average ("SMA") by looking back a certain number of days. One of the most popular "longer look-backs" is the MCO 200 day moving average ("MCO 200 DMA"), while one of the most popular "shorter look-backs" is the MCO 50 day moving average ("MCO 50 DMA"). A chart showing both of these popular moving averages is shown on this page for Moodys. Comparing two moving averages against each other can be a useful visualization tool: by calculating the difference between the MCO 200 DMA and the MCO 50 DMA, we get a moving average convergence divergence indicator ("MCO MACD"). The MCO MACD chart, in conjunction with the chart of the moving averages, basically helps in visualizing how the moving averages are showing convergence (moving closer together), or divergence (moving farther apart). |