NVIDIA has utilized its GPU architecture to create platforms for scientific computing, artificial intelligence (AI), data science, autonomous vehicles, robotics, and augmented and virtual reality. Co. has two segments: Graphics, which includes GeForce GPUs for gaming and PCs, the GeForce NOW game streaming service and related infrastructure, and solutions for gaming platforms, and Quadro/NVIDIA RTX GPUs for enterprise workstation graphics; and Compute and Networking, which includes Data Center platforms and systems for AI, high-performance computing, and accelerated computing, Mellanox networking and interconnect solutions, and cryptocurrency mining processors.
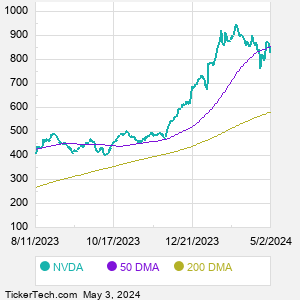
When researching a stock like NVIDIA, many investors are the most familiar with Fundamental Analysis — looking at a company's balance sheet, earnings, revenues, and what's happening in that company's underlying business. Investors who use Fundamental Analysis to identify good stocks to buy or sell can also benefit from NVDA Technical Analysis to help find a good entry or exit point. Technical Analysis is blind to the fundamentals and looks only at the trading data for NVDA stock — the real life supply and demand for the stock over time — and examines that data in different ways. One of those ways is to calculate a Simpe Moving Average ("SMA") by looking back a certain number of days. One of the most popular "longer look-backs" is the NVDA 200 day moving average ("NVDA 200 DMA"), while one of the most popular "shorter look-backs" is the NVDA 50 day moving average ("NVDA 50 DMA"). A chart showing both of these popular moving averages is shown on this page for NVIDIA. Comparing two moving averages against each other can be a useful visualization tool: by calculating the difference between the NVDA 200 DMA and the NVDA 50 DMA, we get a moving average convergence divergence indicator ("NVDA MACD"). The NVDA MACD chart, in conjunction with the chart of the moving averages, basically helps in visualizing how the moving averages are showing convergence (moving closer together), or divergence (moving farther apart). |