PTC is a global software company that provides a portfolio of digital solutions. Co. has two product groups: Computer-Aided Design (CAD) and Product Lifecycle Management (PLM). Products designated as CAD refer to software used for product data authoring. Products designated as PLM refer to software used for product data management and process orchestration. Co.'s products and services include: Windchill® PLM application suite, which manages various aspects of the product development lifecycle by enabling a digital thread of product parts, materials, and configuration information; and Creo® 3D CAD technology, which enables the digital design, testing, and modification of product models.
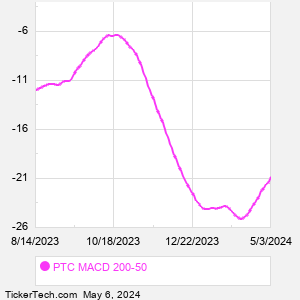
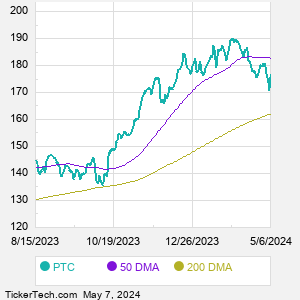
When researching a stock like PTC, many investors are the most familiar with Fundamental Analysis — looking at a company's balance sheet, earnings, revenues, and what's happening in that company's underlying business. Investors who use Fundamental Analysis to identify good stocks to buy or sell can also benefit from PTC Technical Analysis to help find a good entry or exit point. Technical Analysis is blind to the fundamentals and looks only at the trading data for PTC stock — the real life supply and demand for the stock over time — and examines that data in different ways. One of those ways is to calculate a Simpe Moving Average ("SMA") by looking back a certain number of days. One of the most popular "longer look-backs" is the PTC 200 day moving average ("PTC 200 DMA"), while one of the most popular "shorter look-backs" is the PTC 50 day moving average ("PTC 50 DMA"). A chart showing both of these popular moving averages is shown on this page for PTC. Comparing two moving averages against each other can be a useful visualization tool: by calculating the difference between the PTC 200 DMA and the PTC 50 DMA, we get a moving average convergence divergence indicator ("PTC MACD"). The PTC MACD chart, in conjunction with the chart of the moving averages, basically helps in visualizing how the moving averages are showing convergence (moving closer together), or divergence (moving farther apart). |