SMCI MACD


SMCI MACDSMCI DMA
Super Micro Computer is a provider of accelerated compute platforms that are server and storage systems for various markets, including enterprise data centers, cloud computing, artificial intelligence, 5G and edge computing. Co.'s solutions include servers, storage systems, modular blade servers, blades, workstations, rack scale solutions, networking devices, server sub-systems, server management and security software. Co. also provides global support and services to help its customers install, upgrade and maintain their computing infrastructure. Co. provides its customers an array of server models and configurations from which they can choose the solutions to fit their computing needs.

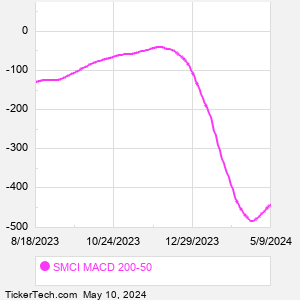
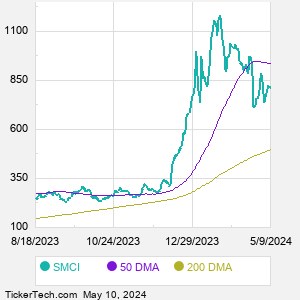
When researching a stock like Super Micro Computer, many investors are the most familiar with Fundamental Analysis — looking at a company's balance sheet, earnings, revenues, and what's happening in that company's underlying business. Investors who use Fundamental Analysis to identify good stocks to buy or sell can also benefit from SMCI Technical Analysis to help find a good entry or exit point. Technical Analysis is blind to the fundamentals and looks only at the trading data for SMCI stock — the real life supply and demand for the stock over time — and examines that data in different ways. One of those ways is to calculate a Simpe Moving Average ("SMA") by looking back a certain number of days. One of the most popular "longer look-backs" is the SMCI 200 day moving average ("SMCI 200 DMA"), while one of the most popular "shorter look-backs" is the SMCI 50 day moving average ("SMCI 50 DMA"). A chart showing both of these popular moving averages is shown on this page for Super Micro Computer. Comparing two moving averages against each other can be a useful visualization tool: by calculating the difference between the SMCI 200 DMA and the SMCI 50 DMA, we get a moving average convergence divergence indicator ("SMCI MACD"). The SMCI MACD chart, in conjunction with the chart of the moving averages, basically helps in visualizing how the moving averages are showing convergence (moving closer together), or divergence (moving farther apart).
10 Most Oversold S&P 500 Stocks
10 Most Overbought S&P 500 Stocks

10 ETFs With Stocks Insiders Are Buying
10 ETFs With Most Upside To Targets
The DividendRank Top 25
Warren Buffett Dividend Stocks
10 Cheap Dividend Stocks Under $10
10 Top DividendRank'ed Energy Stocks
The 10 Highest Yielding Preferred Stocks
The 15 Most Active S&P Call & Put Options
Quotes delayed 20 minutes

Email EnvelopeFree SMCI Email Alerts:
Get Dividend Alerts
Get SEC Filing Alerts
Video: Technical Analysis


If the video does not load after a few moments, Upgrade to the Latest Flash Player.
Super Micro Computer (SMCI) is categorized under the Technology sector; to help you further research MACD, below are some other companies in the same sector:

SNPS MACD
STX MACD
SWKS MACD
T MACD
TDY MACD
TER MACD
TMUS MACD
TRMB MACD
TTWO MACD
TXN MACD
More Technology companies »


SMCI MACD | www.StockMACD.com | Copyright © 2019 - 2024, All Rights Reserved

Nothing in StockMACD.com is intended to be investment advice, nor does it represent the opinion of, counsel from, or recommendations by BNK Invest Inc. or any of its affiliates, subsidiaries or partners. None of the information contained herein constitutes a recommendation that any particular security, portfolio, transaction, or investment strategy is suitable for any specific person. All viewers agree that under no circumstances will BNK Invest, Inc,. its subsidiaries, partners, officers, employees, affiliates, or agents be held liable for any loss or damage caused by your reliance on information obtained. By visiting, using or viewing this site, you agree to the following Full Disclaimer & Terms of Use and Privacy Policy. Video widget and market videos powered by Market News Video. Quote and option data delayed at least 15 minutes; stock quote data powered by Ticker Technologies, and Mergent.
X
Wait! Don't leave yet.
Want to receive our latest research absolutely free?


Click the button below for your complimentary copy of Your Early Retirement Portfolio: Dividends Up to 8.7%—Every Month—Forever.

You'll discover the details on 4 stocks and funds that pay you massive dividends as high as 8.7%.