Synopsys engages in supplying the electronic design automation software that engineers use to design and test integrated circuits. Co. also provides semiconductor intellectual property products, which are pre-designed circuits that engineers use as components of larger chip designs. Co. provides software and hardware used to validate the electronic systems that incorporate chips and the software that runs on them. In addition, Co. provides technical services and support to help its customers develop chips and electronic systems. Co. also provides software tools and services in a variety of industries, including electronics, financial services, automotive, medicine, energy and industrials.
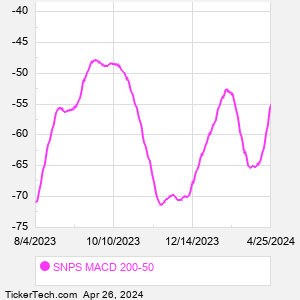
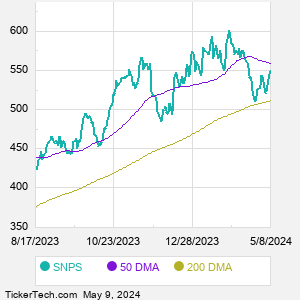
When researching a stock like Synopsys, many investors are the most familiar with Fundamental Analysis — looking at a company's balance sheet, earnings, revenues, and what's happening in that company's underlying business. Investors who use Fundamental Analysis to identify good stocks to buy or sell can also benefit from SNPS Technical Analysis to help find a good entry or exit point. Technical Analysis is blind to the fundamentals and looks only at the trading data for SNPS stock — the real life supply and demand for the stock over time — and examines that data in different ways. One of those ways is to calculate a Simpe Moving Average ("SMA") by looking back a certain number of days. One of the most popular "longer look-backs" is the SNPS 200 day moving average ("SNPS 200 DMA"), while one of the most popular "shorter look-backs" is the SNPS 50 day moving average ("SNPS 50 DMA"). A chart showing both of these popular moving averages is shown on this page for Synopsys. Comparing two moving averages against each other can be a useful visualization tool: by calculating the difference between the SNPS 200 DMA and the SNPS 50 DMA, we get a moving average convergence divergence indicator ("SNPS MACD"). The SNPS MACD chart, in conjunction with the chart of the moving averages, basically helps in visualizing how the moving averages are showing convergence (moving closer together), or divergence (moving farther apart). |