Teledyne Technologies provides technologies for industrial markets. Co.'s businesses are aligned in four segments: Digital Imaging, which includes sensors, cameras and systems, within the visible, infrared, ultraviolet and X-ray spectra; Instrumentation, which provides monitoring and control instruments; Aerospace and Defense Electronics, which provides electronic components and subsystems, data acquisition and communications components and equipment, environment interconnects, general aviation batteries and other components; and Engineered Systems, which provides systems engineering, integration and technology development, and manufacturing solutions.
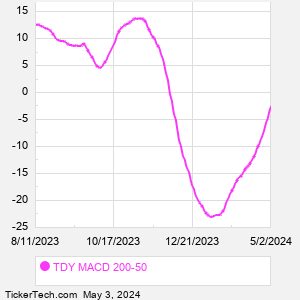
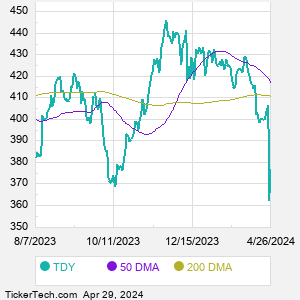
When researching a stock like Teledyne Technologies, many investors are the most familiar with Fundamental Analysis — looking at a company's balance sheet, earnings, revenues, and what's happening in that company's underlying business. Investors who use Fundamental Analysis to identify good stocks to buy or sell can also benefit from TDY Technical Analysis to help find a good entry or exit point. Technical Analysis is blind to the fundamentals and looks only at the trading data for TDY stock — the real life supply and demand for the stock over time — and examines that data in different ways. One of those ways is to calculate a Simpe Moving Average ("SMA") by looking back a certain number of days. One of the most popular "longer look-backs" is the TDY 200 day moving average ("TDY 200 DMA"), while one of the most popular "shorter look-backs" is the TDY 50 day moving average ("TDY 50 DMA"). A chart showing both of these popular moving averages is shown on this page for Teledyne Technologies. Comparing two moving averages against each other can be a useful visualization tool: by calculating the difference between the TDY 200 DMA and the TDY 50 DMA, we get a moving average convergence divergence indicator ("TDY MACD"). The TDY MACD chart, in conjunction with the chart of the moving averages, basically helps in visualizing how the moving averages are showing convergence (moving closer together), or divergence (moving farther apart). |