Mondelez International sells food and beverage products. Co. is engaged in making and selling chocolate, biscuits and baked snacks. Co. also has additional businesses including gum and candy, cheese and grocery and powdered beverages. Co.'s portfolio includes brands such as Oreo, Ritz, LU, CLIF Bar and Tate's Bake Shop biscuits and baked snacks, as well as Cadbury Dairy Milk, Milka and Toblerone chocolate. Co. sells its products to supermarket chains, wholesalers, supercenters, club stores, mass merchandisers, distributors, convenience stores, gasoline stations, drug stores, value stores and other retail food outlets.
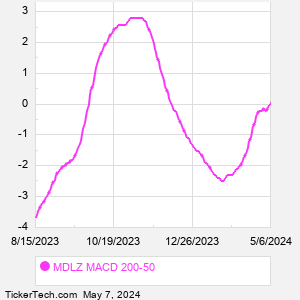
When researching a stock like Mondelez International, many investors are the most familiar with Fundamental Analysis — looking at a company's balance sheet, earnings, revenues, and what's happening in that company's underlying business. Investors who use Fundamental Analysis to identify good stocks to buy or sell can also benefit from MDLZ Technical Analysis to help find a good entry or exit point. Technical Analysis is blind to the fundamentals and looks only at the trading data for MDLZ stock — the real life supply and demand for the stock over time — and examines that data in different ways. One of those ways is to calculate a Simpe Moving Average ("SMA") by looking back a certain number of days. One of the most popular "longer look-backs" is the MDLZ 200 day moving average ("MDLZ 200 DMA"), while one of the most popular "shorter look-backs" is the MDLZ 50 day moving average ("MDLZ 50 DMA"). A chart showing both of these popular moving averages is shown on this page for Mondelez International. Comparing two moving averages against each other can be a useful visualization tool: by calculating the difference between the MDLZ 200 DMA and the MDLZ 50 DMA, we get a moving average convergence divergence indicator ("MDLZ MACD"). The MDLZ MACD chart, in conjunction with the chart of the moving averages, basically helps in visualizing how the moving averages are showing convergence (moving closer together), or divergence (moving farther apart). |